Change Country
-or-

When undertaking formulation work don’t confuse Mixture DOE’s with Factorial/RSM DOE’s
A potential error among DOE practitioners undertaking formulation work is to confuse Mixture DOE with Factorial/RSM DOE’s. This can lead to unsatisfactory or misleading outcomes. Formulation DOE’s are typically undertaken in the food, chemical, petrochemical, paint, cosmetics, and pharmaceutical industries.
The key differences between the two broad types of DOE’s are as follows:
Consider the two examples that follow. Compare the worksheet layout in Table 2 and Table 3. Note that in Table 2 for the factorial RSM design the factor levels are independent of each other. In the Paint formulation mixture DOE represented by the worksheet of Table 3, it will be observed that for each experimental run the proportions of each ingredient always adds up to 100. If the proportion of one ingredient changes from run to run, the proportion of at least one of the other ingredients must change to compensate. This is a classic example of a mixture DOE. If it was attempted to design the paint hardness formulation as a factorial RSM, with the ingredients treated as factors the conclusions drawn from the experiment would be incorrect.
Example 1 A Factorial/RSM DOE
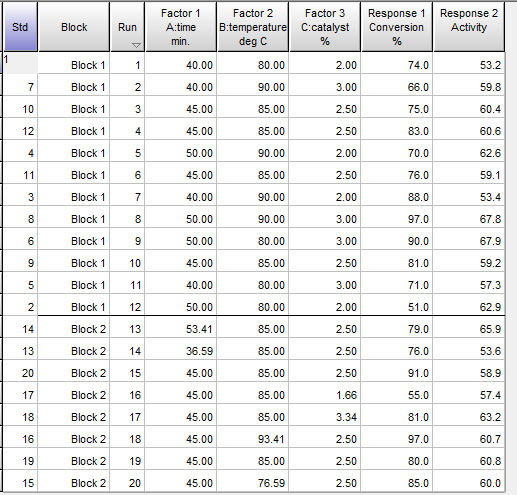
In this RSM example, the response is conversion % in a chemical process. The factors and levels are set out in Table 1. The worksheet layout is shown in Table 2 and the contour and 3D response surface are illustrated in Graph 1 and Graph 2 respectively.
Table 1
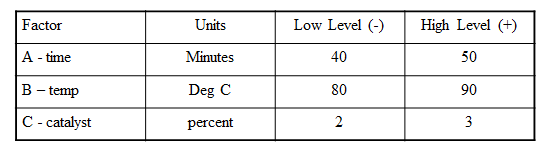
Table 2
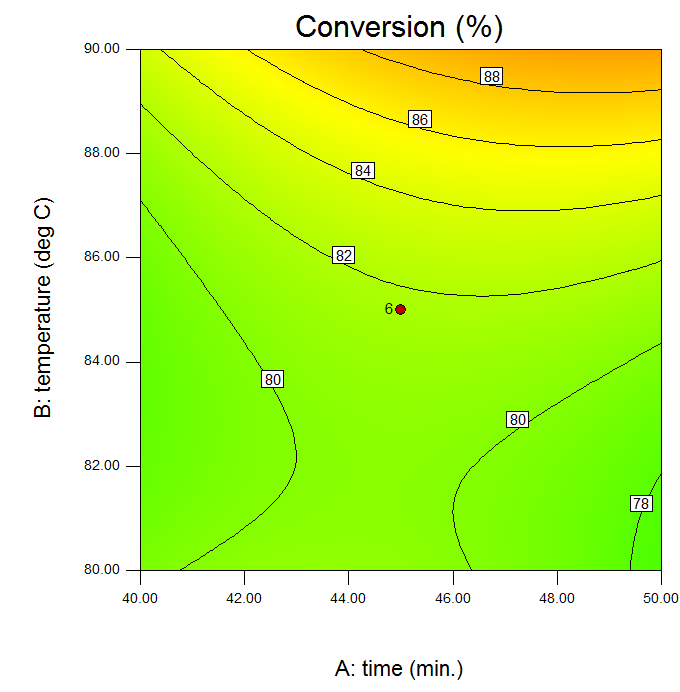
Graph 1 Contour plot for RSM Design – Factor No 3, Catalyst is set at 2% for this display
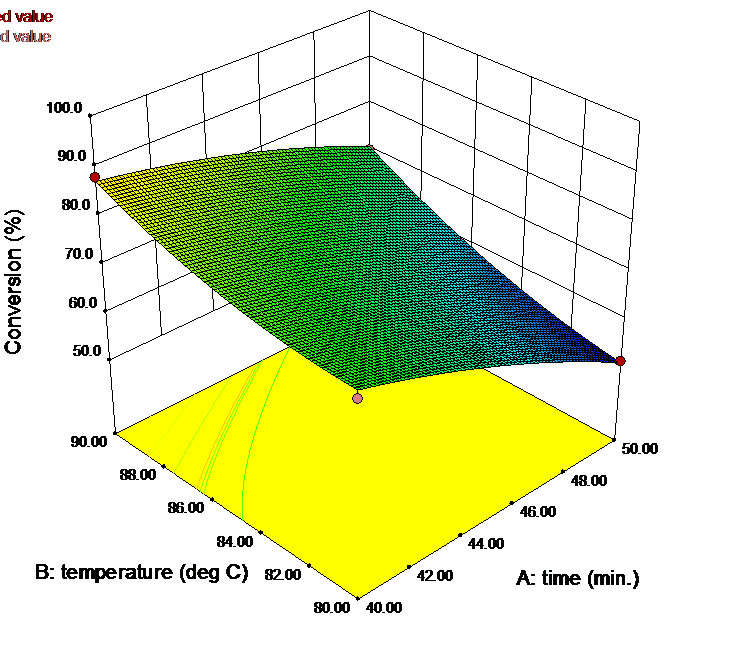
Graph 2 3 D Surface – Factor No 3, Catalyst is set at 2% for this display
Example 2 A Mixture DOE
An experimenter is trying to optimize the formulation of automotive clear coat paint. One of the responses is solids, which the customer wants below 30. The clear coat is a three component mixture, consisting of a monomer, a crosslinker, and a resin. There are constraints on the component proportions:
5 ≤ A (Monomer) ≤ 25
25 ≤ B (Crosslin ker) ≤ 40
50 ≤ C (Re sin) ≤ 70.
A + B + C = 100
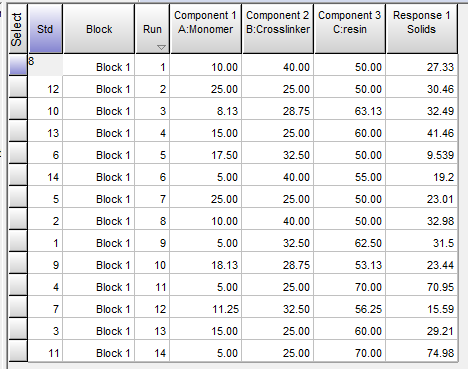
The worksheet layout is shown in Table 3. The contour plot and 3D response surface are illustrated in Graph 3 and Graph 4 respectively.
Table 3
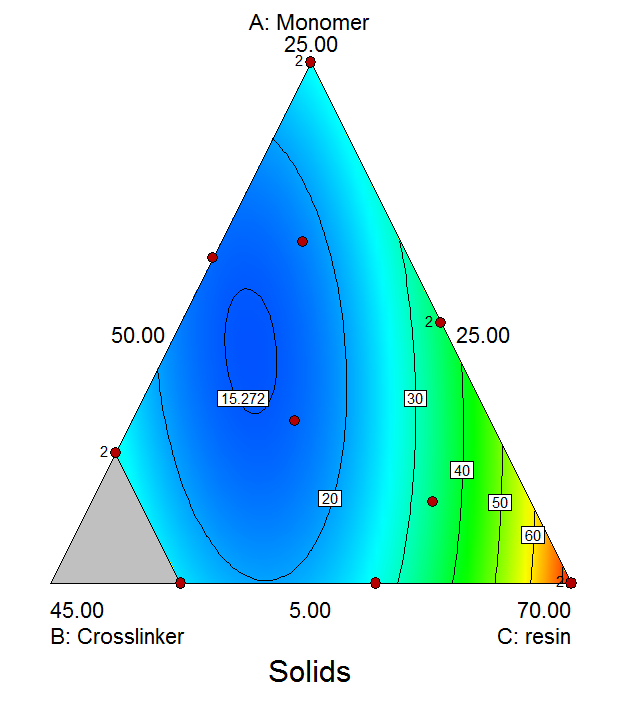
Graph 3 Contour for Paint Solids
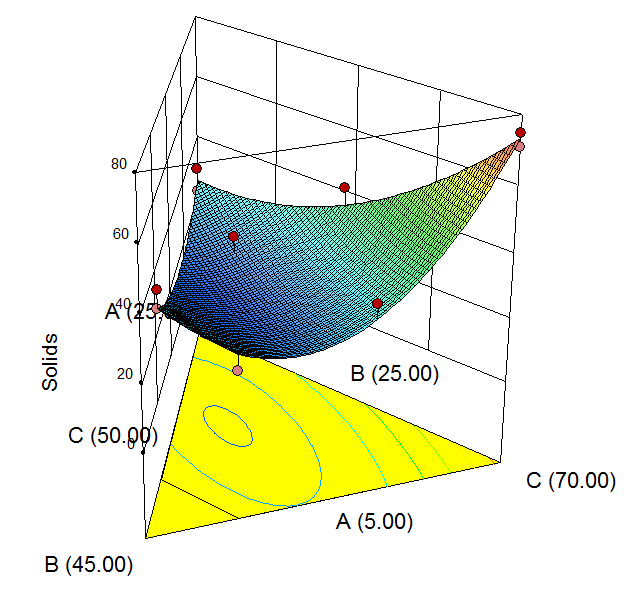
Graph 4 3D Surface for Paint Solids
Learn more about the different types of DOE by attending our Advanced Design of Experiments training course.
Submitted by our expert DOE Tutor Albert Plant

 Categories
 Archive
Sign up to receive the latest industry and company news direct to your inbox.